Graphical abstracts
How to Turn a Study’s Main Finding Into a Graphical Abstract
A graphical abstract gives readers a compact visual account of what a study asked, did, or found. The strongest starting point is the message the paper supports.
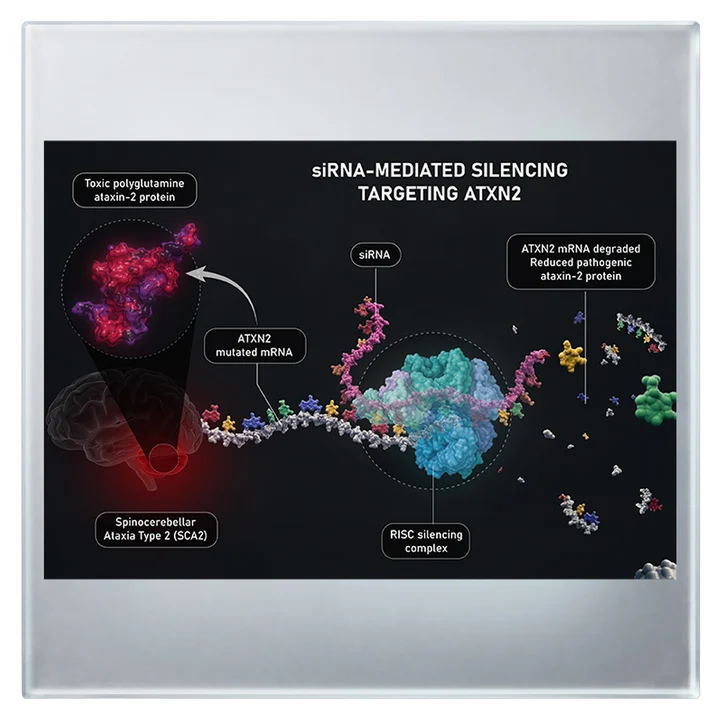
Choose a message the study can support
Write the takeaway in one sentence. For a mechanism, the visual may follow the target, the intervention, and the observed effect. For a comparison, two parallel views may be clearer than a sequence. Show whether the relationship is observed or proposed. A causal arrow can overstate an association if the study did not test causation.
Give readers a path through the figure
Place elements in the order they should be read. Use a few short labels for the subject, the change, and the outcome. Keep conditions and symbols consistent across the graphic. Test it at the size it will appear online. If the visual relies on a long caption to explain the main idea, revisit the layout.
Check the target journal before exporting
Publisher requirements vary by journal. Elsevier, for example, asks authors to consult their journal’s specific guidance. Include the intended journal, the abstract, a figure or data point that supports the takeaway, and any required dimensions or file formats when you brief an illustrator.